
Using the Heat Index Chart to Work Safely in Hot Weather
By Grainger Editorial Staff 4/18/24
High humidity makes hot weather so much worse.
Why? It all comes down to how you sweat.
When sweat evaporates from your skin, it takes some of your body heat with it. This makes sweating one of the only ways for your body to cool itself down. But as the air gets more humid, it has less room for more water vapor, so evaporation slows. You can sweat all you want, but it won’t have much cooling effect.
It’s not just your comfort that’s at stake. As your body depletes its supply of water and salt in the fight to stay cool, it can lead to painful cramps and symptoms of heat exhaustion.
And once your body can no longer control its temperature by sweating, heat stroke can occur, with your internal temperature quickly rising to 106 degrees F or higher. Without emergency treatment, heat stroke can cause disability or death.
The heat index is a way to estimate the effect humidity has on how hot weather feels – and how dangerous it can be for people working or spending time in it.
Heat Index Chart
| 80° | 82° | 84° | 86° | 88° | 90° | 92° | 94° | 96° | 98° | 100° | 102° | 104° | 106° | 108° | |
|---|---|---|---|---|---|---|---|---|---|---|---|---|---|---|---|
| 40% | 80° | 81° | 83° | 85° | 88° | 91° | 94° | 97° | 101° | 105° | 109° | 114° | 119° | 124° | 130° |
| 45% | 80° | 82° | 84° | 87° | 89° | 93° | 96° | 100° | 104° | 109° | 114° | 119° | 124° | 130° | 137° |
| 50% | 81° | 83° | 85° | 88° | 91° | 95° | 99° | 103° | 108° | 113° | 118° | 124° | 131° | 137° | |
| 55% | 81° | 84° | 86° | 89° | 93° | 97° | 101° | 106° | 112° | 117° | 124° | 131° | 137° | ||
| 60% | 82° | 84° | 88° | 91° | 95° | 100° | 105° | 110° | 116° | 123° | 129° | 137° | |||
| 65% | 82° | 85° | 89° | 93° | 98° | 103° | 108° | 114° | 121° | 128° | 136° | ||||
| 70% | 83° | 86° | 90° | 95° | 100° | 105° | 112° | 119° | 126° | 134° | |||||
| 75% | 84° | 88° | 92° | 97° | 103° | 109° | 116° | 124° | 132° | ||||||
| 80% | 84° | 89° | 94° | 100° | 106° | 113° | 121° | 129° | |||||||
| 85% | 85° | 90° | 96° | 102° | 110° | 117° | 126° | 135° | |||||||
| 90% | 86° | 91° | 98° | 105° | 113° | 122° | 131° | ||||||||
| 95% | 86° | 93° | 100° | 108° | 117° | 127° | |||||||||
| 100% | 87° | 95° | 103° | 112° | 123° | 132° |
| Likelihood of Heat Disorders with Prolonged Exposure or Strenuous Activity |
|---|
| Caution |
| Extreme Caution |
| Danger |
| Extreme Danger |
Using the Heat Index Chart
This chart was developed by the National Weather Service (NWS). To read it, find the column closest to the actual temperature and the row closest to the current relative humidity. Where the row and the column intersect, you’ll find an indication of how it “feels” under those conditions. The chart is color coded to indicate the level of danger posed by prolonged exposure or strenuous activity. The heat index assumes you'll be in the shade, and direct sunlight can add another 13.5 degrees F.
OSHA and NIOSH offer a heat safety app for phones and tablets that allows you to calculate the heat index, shows the risk level and offers reminders about protective measures that are appropriate for the risk level.
According to OSHA, the heat index can be a helpful screening tool as part of more comprehensive workplace assessment. However, it’s important to remember that severe heat-related illness can happen even at heat index values that might seem low. The agency has found that workers have died from heat stroke when the heat index was no more than 86 degrees F.
Limitations of the Heat Index
The NWS heat index chart has some limitations, however. It's based on calculations made by Robert Steadman, a textile physicist. He developed mathematical equations to simulate how the body of an idealized person would respond to different temperatures and humidities.
According to a 2022 paper in the Journal of Applied Meteorology and Climatology (JAMC), the heat index model includes many assumptions to keep things simple. The mathematical equations assume that:
- The person is in the shade with a steady breeze.
- The person isn’t working hard.
- The person has as much water as they need and is drinking it as needed.
- The person can remove any and all clothing as needed.
But for people working in the heat, the reality will probably be much different. This throws the heat index off. Direct sunlight and hot winds are two factors .
Another limitation of the heat index is the way values are calculated for some extreme conditions, according to the JAMC paper. The authors of the paper believe that the heat index underestimates how it feels in very hot and humid weather. Their corrected heat index chart has values more than 20° F higher for the most extreme conditions. For example, while the NWS heat index indicates that 90% humidity on an 88° F day feels like 113° F in the shade, those same conditions would actually feel like 139° F according to the corrected chart.
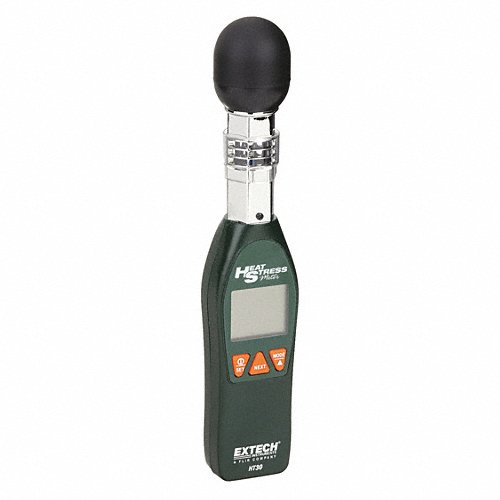
Wet Bulb Globe Temperature for Hazard Assessment
Rather than relying only on the heat index, OSHA recommends that heat hazard assessments use a wet bulb globe temperature (WBGT) taken on the worksite.
A WBGT heat stress monitor combines measurements of three different conditions: the ambient air temperature, the potential for evaporative cooling and the radiant heat. The most obvious source of radiant heat is the sun, but it can also come from ovens, furnaces, hot pavements and lights.
Additionally, OSHA’s process for heat hazard assessments takes into account clothing and workload. The details are described in Section III Chapter 4 of the OSHA Technical Manual.
While the heat index chart can be a helpful screening tool, WBGT is OSHA's preferred assessment method.

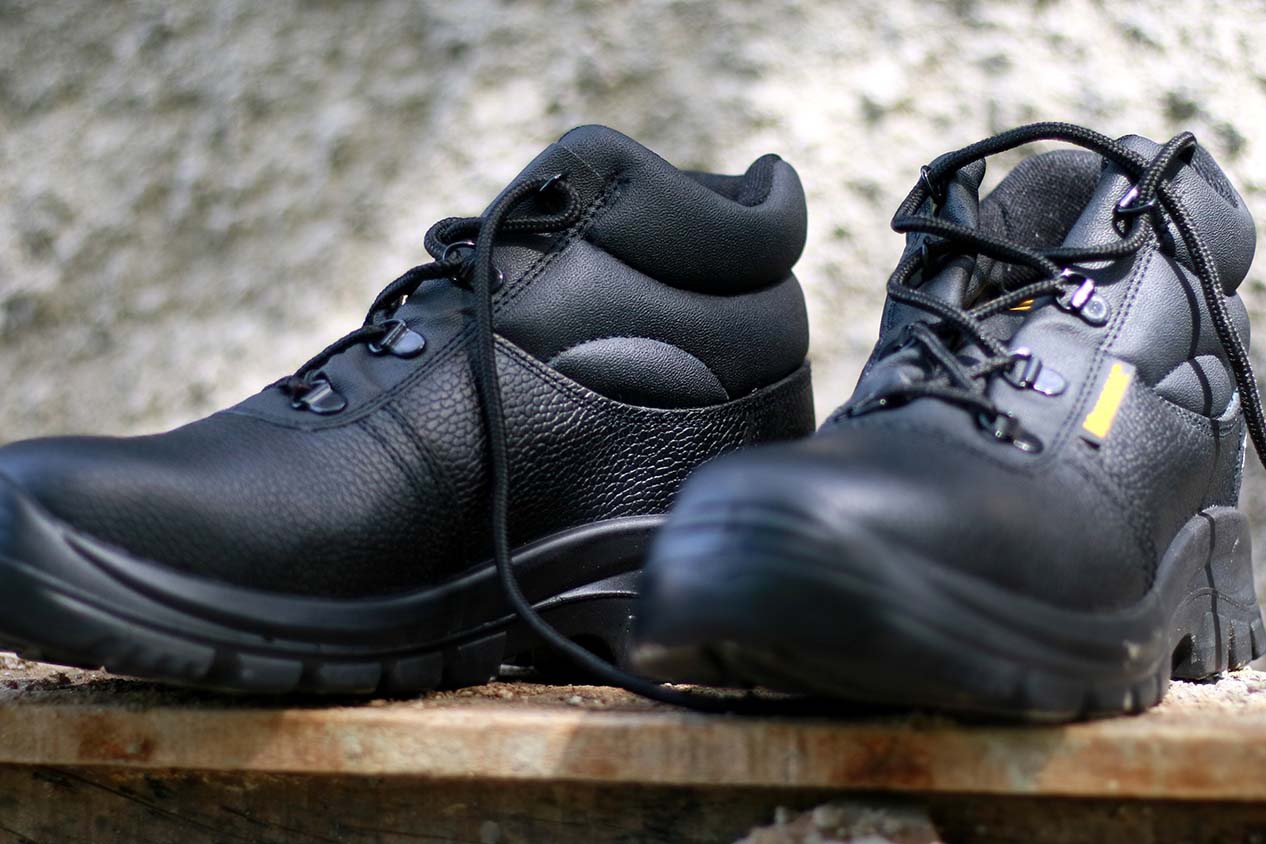
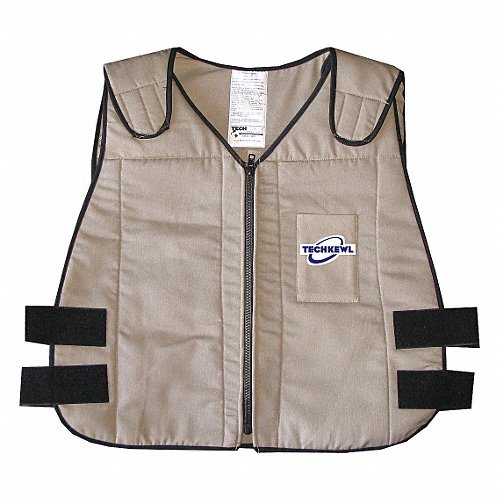
PPE in the Workplace
Gender-Specific PPE: Finding PPE Fit for Women
Learn why properly fitting PPE for women helps improve safety, comfort and compliance and how employers can support access to gear that fits.

![]() Our Latest KnowHow
Our Latest KnowHow
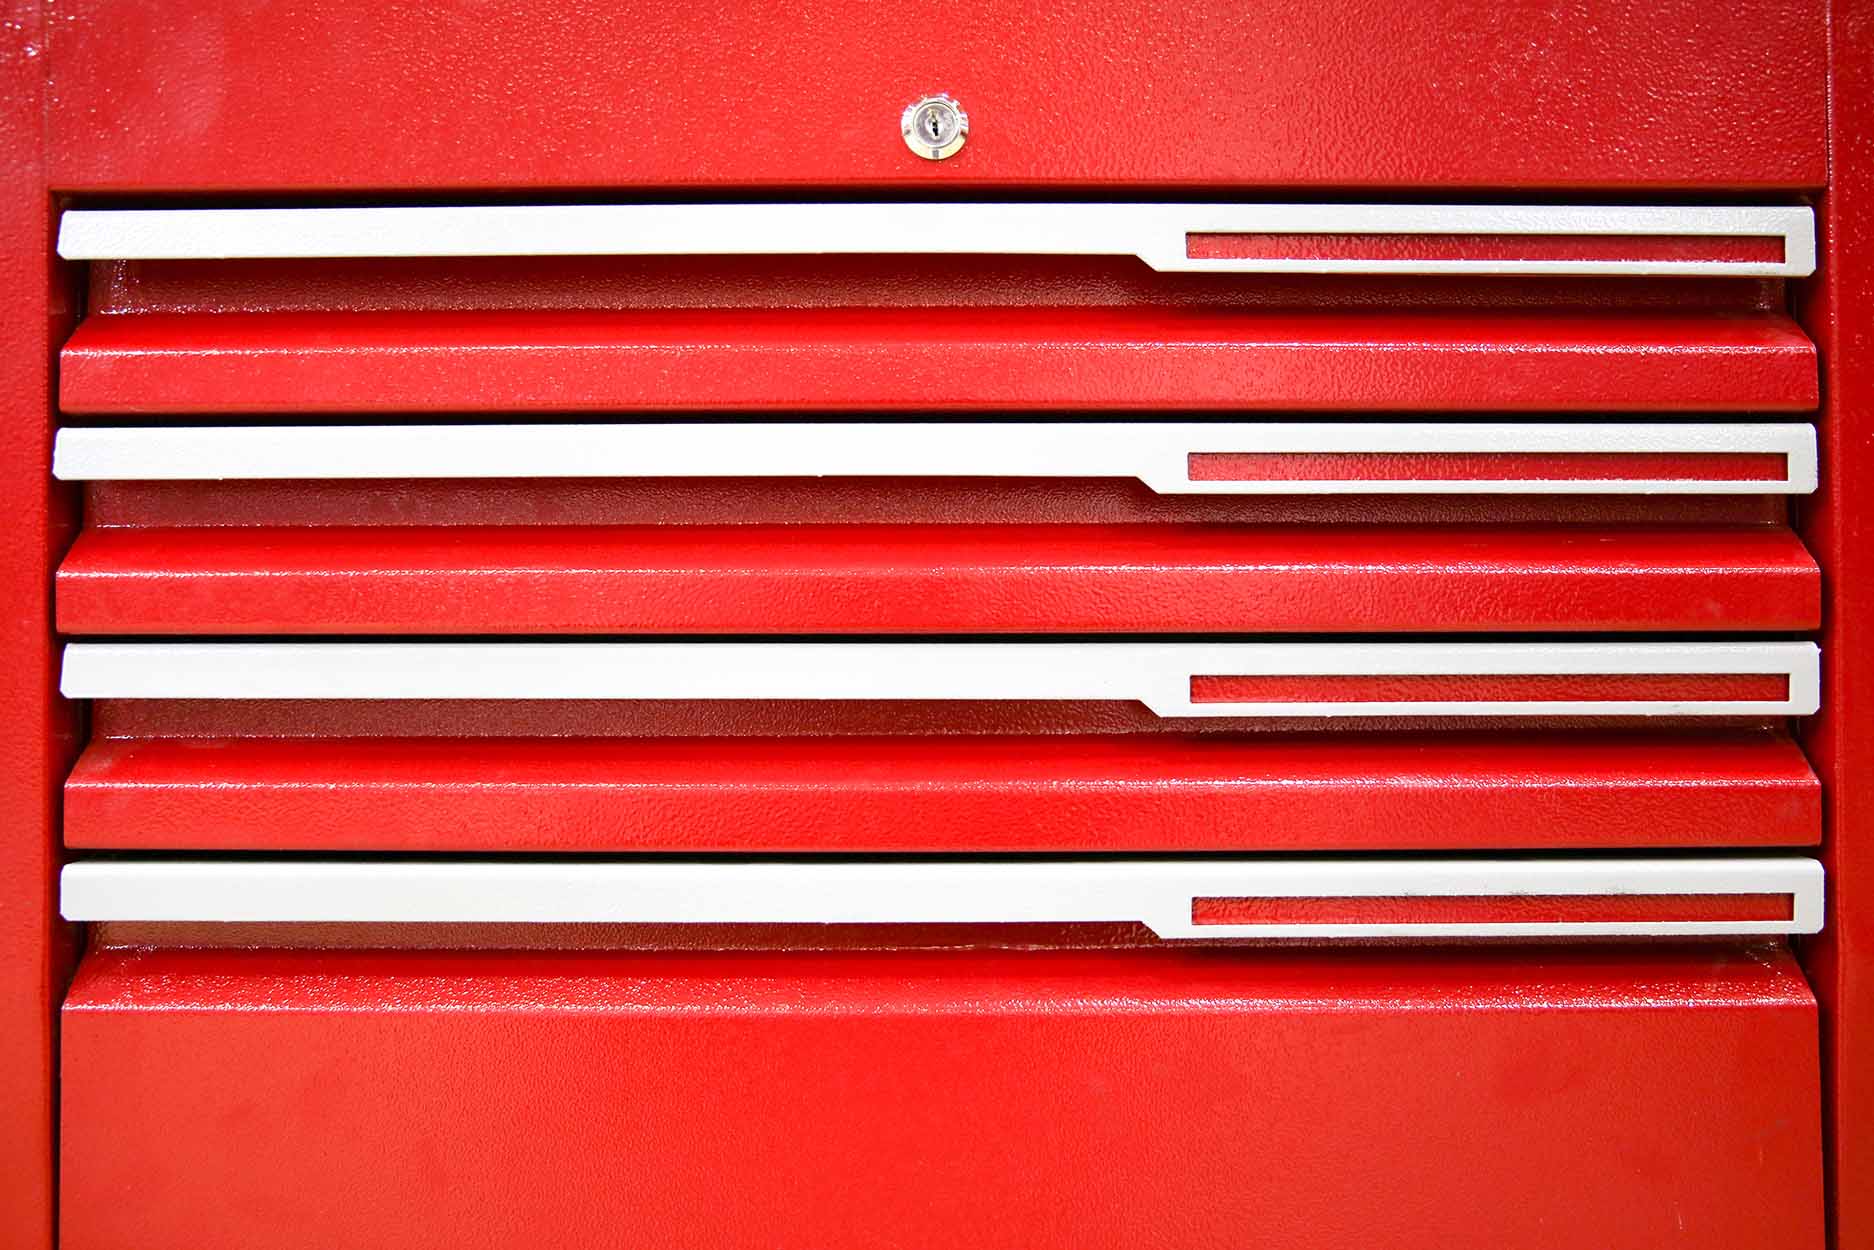
The Complete Tool Storage and Organization Guide
Storing tools the right way makes life easier. Tool storage cabinets, tool chests and lockers are just the beginning to storage and organization.


The information contained in this article is intended for general information purposes only and is based on information available as of the initial date of publication. No representation is made that the information or references are complete or remain current. This article is not a substitute for review of current applicable government regulations, industry standards, or other standards specific to your business and/or activities and should not be construed as legal advice or opinion. Readers with specific questions should refer to the applicable standards or consult with an attorney.


CONNECT WITH US


SIGN UP FOR EMAIL
Get more great content in your inbox.